Patent pending web-based application with precise cloud computations
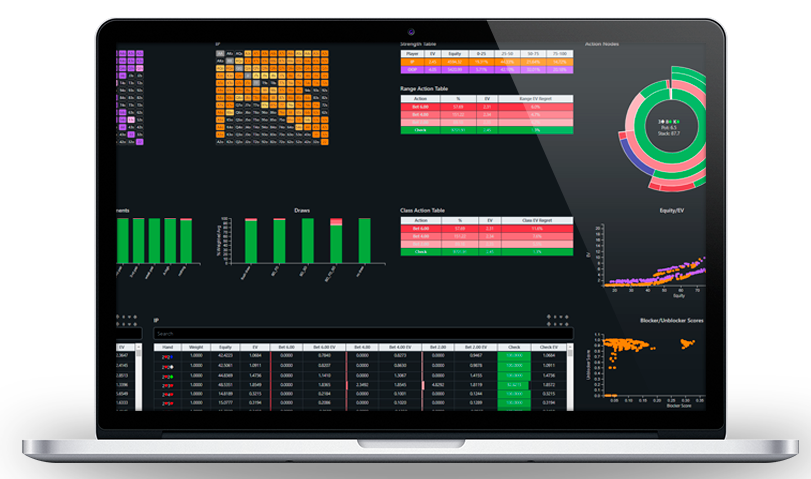
GTO mathematically defines the unexploitable strategy for each decision point in poker. However, the full GTO solution is extremely complex, making it infeasible to memorize every possible spot in the game. As such, to "master" GTO it is necessary to simplify strategies as much as possible so that we are able to identify patterns and develop principles that may be applied across different scenarios. Unfortunately, there is a trade-off between simplifying the game and retaining the expected value (EV) from the solved strategies. GTOx addresses this dilemma through a systematic method of structuring hand analysis into 3 levels of increasing granularity, where the simplified, higher-level strategies are used when doing so will not lose us significant EV. The goal is to maximize the efficiency of your study time by focusing on major leaks first, where the most EV is lost instead of obsessing over minutia which will not produce material, long-run EV gains against most human opponents.
The MacroAnalysis evaluates the overall strategy of Hero's range. The primary focus at this level is on range advantage, position and SPR, since typically these factors significantly influence how specific holdings within the range are played.
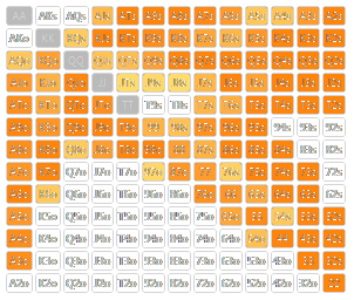
These grids show the possible hands which each player is likely to hold given prior actions. Hands which are more likely to be in a player's range are shaded darker. The GTOx dashboard juxtaposes both player's ranges since in GTO, strategies are wholly devised based upon how the ranges stack up against each other relative to the board.
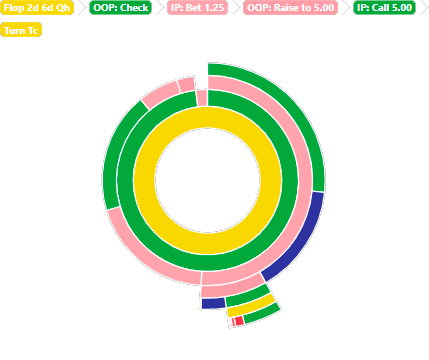
The strategy sunburst shows the frequencies of the possible actions at the current node for the entire range, as well as the actions available at prior decision points in the game. This visual depiction of actions can assist users in learning to assess how prior actions define each player's range, which is a critical skill in GTO.
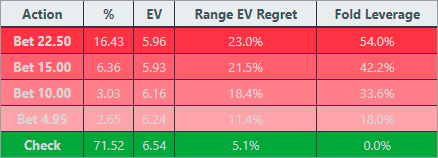
This table shows the average frequencies and resulting EV for each possible action for the range as a whole. Also shown is the Range EV Regret for each action, which measures the maximum amount of EV that will be lost if a player takes that action with 100% of the hands in the range and can aid in simplifying strategies. EV Regret is standardized by the pot size so each player can set his/her own EV Regret significance threshold based on his/her experience and skill level. Finally, this table shows "Fold Leverage", which is equal to the percentage of the opponent's range that folds to each bet at the nash-equilibrium.
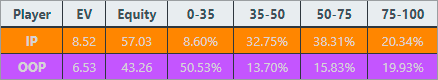
This table shows the average EV, average equity and equity distribution for each player. EV measures the expected number of chips the player will win on average if it follows the optimal strategies. Equity measures the probability of the player winning or tying at showdown if no further betting occurs. The equity distribution aids in an understanding of overall composition of each player's range (e.g. polarized, capped, condensed, merged, etc.).
The MesoAnalysis evaluates the strategy of Hero's hand class based upon its strength. The primary focus at this level is to determine which strength class the Hero's hand belongs to relative to the Villain's distribution of possible hands and the tendencies of such class.
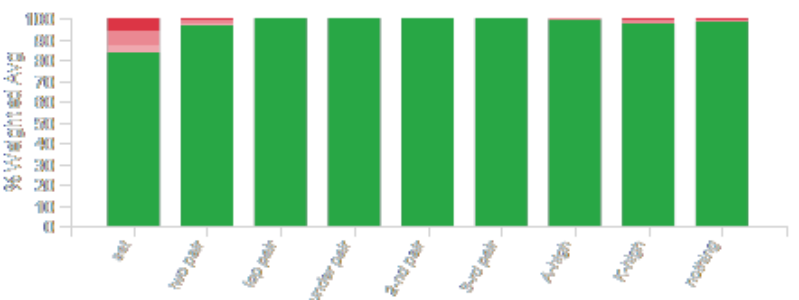
This chart displays the optimal average frequencies of actions for each segment in the Hero's range. A user can create a "class" of hands by clicking on one or more segments. Grouping specific holdings into classes helps simplify the game and reinforce our understanding of how hand strength in general affects strategies, as specific hands within the same class may often have similar EV, equities and strategies.
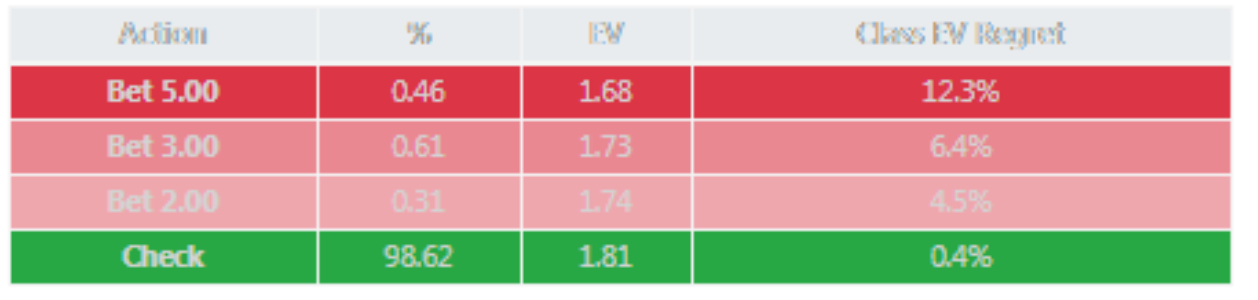
This table shows the average frequencies and resulting EV for each possible action for the class of hands selected by user. Also shown is the Class EV Regret for each action, which measures the maximum amount of EV that will be lost if a player takes that action with 100% of the hands in the class and can aid in simplifying strategies.
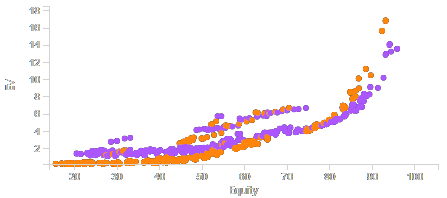
This chart displays each hand in the range by equity and EV for the Hero and the Villain. This chart is particularly useful to aid in our understanding of where the Hero's hand exists in the equity distribution.
The MicroAnalysis evaluates the optimal strategies for hero's specific hand. The primary focus at this level is to identify and understand how specific characteristics of hands (i.e. incremental equity, blockers and unblockers) differentiate GTO strategies for similarly situated combos within the same class.
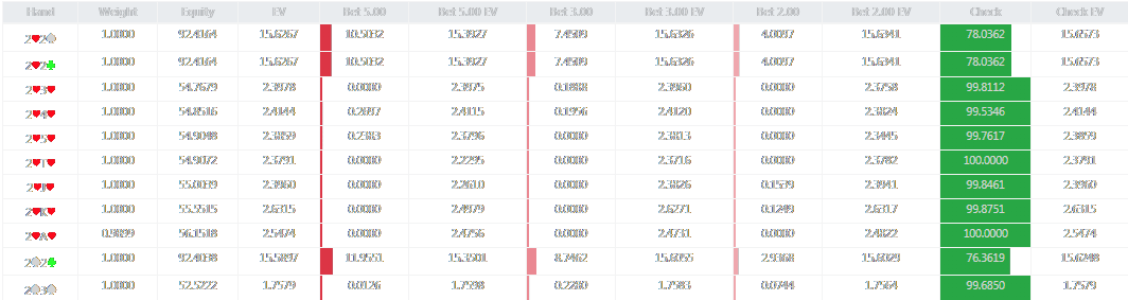
These tables show the weight, equity and EV of each hand for each player, as well as the optimal strategies for the player with a decision. This table can be filtered by utilizing the other charts in the dashboard and can be searched for specific cards.
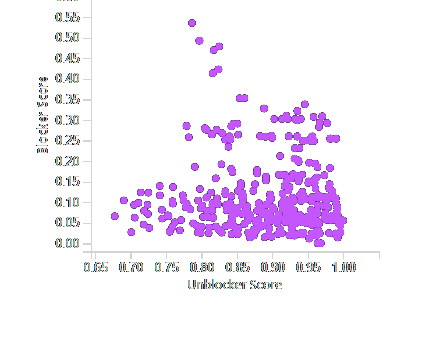
This chart measures each hand's blocking and unblocking qualities, which are often highly influential in close decision spots. The Blocker Score measures how much EV is removed from the Villain's hands with greater equity by virtue of the card removal effects of the Hero's hand. The Unblocker Score measures how much EV is not removed from the Villain's hands with lower equity (with a floor of 35%) by virtue of the card removal effects of the Hero's hand.